In a series of data-driven lists, CVSuite documents the economic
impact of arts and culture on local economies. The data supports
and showcases stories that highlight the creative and cultural
vibrancy of communities across the United States.
DATA-DRIVEN
LISTS CHRONICLING THE
CREATIVE ECONOMY

City of Santa Monica Art of Recovery | Main Street K-Rail Mural Project by Ms. Yellow. 2020. Image courtesy of Poppy & Co.
CAPTURING THE
IMAGINATION OF
CREATIVE ECONOMIES
REPRESENT
PLACE
PLACE
Through close collaboration with creative regions and the communities they serve, the CVList embraces the promise and complexity of places and their unique creative economies.
AMPLIFY
ALL VOICES
ALL VOICES
The CVList uses creative economy data to highlight and share stories of culture workers in rural, indigenous, and other under-resourced communities.
EMBRACE
IDENTITY
IDENTITY
The CVList applies the belief that the arts are an expression and celebration of the unique and diverse identities of all people.
DEFINE CREATIVE
VITALITY
VITALITY
Through technology, research, and economic analysis, the CVList applies the belief that thriving creative sectors make better places to live, work, and play.
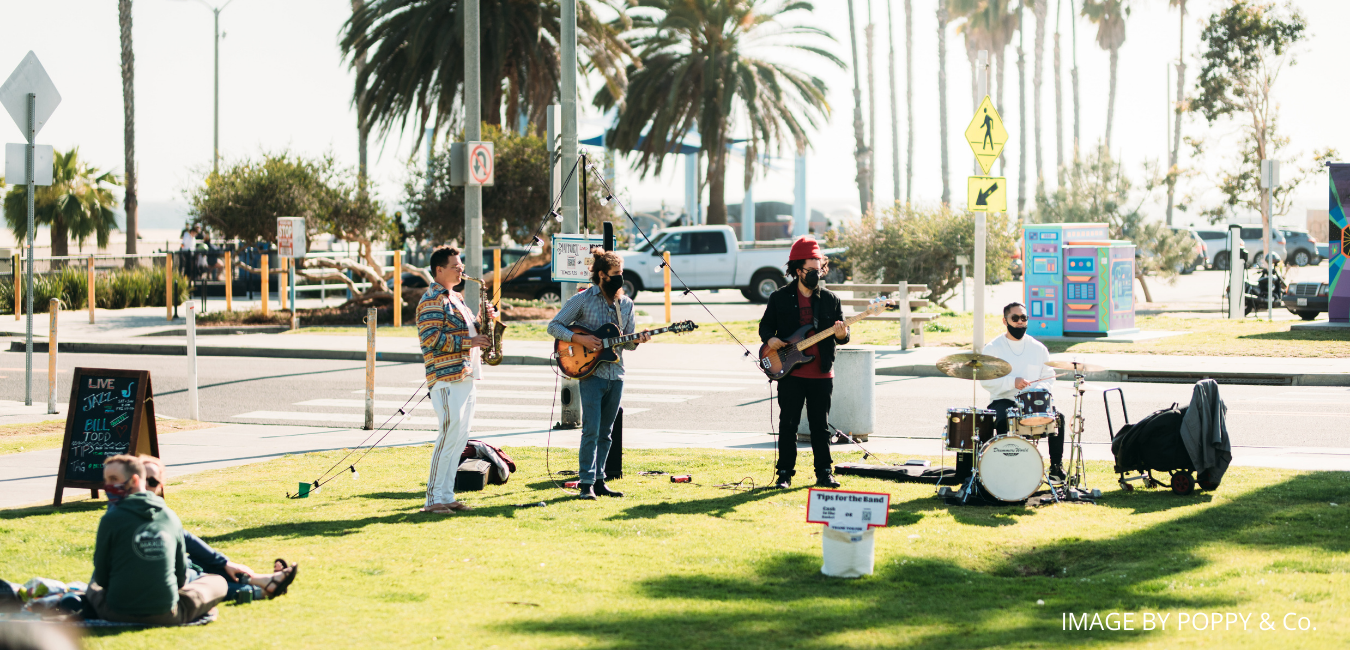
Image courtesy of Poppy & Co.
HOW DO YOU
MEASURE CREATIVE
VITALITY?
Creative vitality encompasses more than just one group of industries, occupations, or set of nonprofit organizations. Creative Vitality Suite knows this, which is why we created the Creative Vitality Index (CVI). The CVI allows users to measure important economic signals that correlate to a region’s overall creative economic health and compares them as a ratio to that of the United States. (i.e. A CVI value of 1.5 means the creative vitality of a region is 1.5 times more concentrated than that of the United States). The CVI considers not just creative industries, occupations, or arts and cultural nonprofits alone, it combines them all—while also considering the region’s density.
OCCUPATIONS
In calculating a region’s CVI value, it’s important to consider the businesses that make up the area’s creative economy. However, it’s equally important to consider the workers that comprise those businesses. The CVI consists of 39 occupations organized by Standard Occupational Classification (SOC) codes that utilize skills highly correlated with creativity. When measuring an area’s creative economy, it is important to consider the number of jobs that are added to the workforce by creative workers and the demographic make-up of the creative economy in the region. Including this information helps the data paint an accurate picture of the area’s creative vitality with respect to occupations.
INDUSTRIES
The presence and productivity of certain industries also indicate creative vitality within a region. The CVI includes data from 9 industries that are included in the North American Industry Classification System (NAICS), such as independent artists, writers, and performers and art dealers.
NONPROFIT
The creative vitality of an area isn’t just measured by monetary profit. The financial resources that a region has set aside to uplift arts and culture also play a role. That’s why the CVI includes revenues from 45 carefully selected types of organizations using the National Taxonomy of Exempt Entities Classification (NTEE) codes that define arts and cultural nonprofits. Those nonprofit revenues make up 20% of the CVI’s measure of the creative economy.
POPULATION
An area’s creative vitality cannot be measured by a single factor. Because less dense regions are also creative hotspots, the CVI looks at combinations of creative factors per person, known as a per capita measurement. By assessing creative activity in this way, the CVI answers the question: How much access does a community member have to creative opportunities?
IS YOUR CITY
ON THE LIST?